


The latest thought leadership, news, events, and more from Woolpert Digital Innovations
From Static Placement to Predictive Visibility

How Geospatial AI is Reshaping Outdoor Advertising
For decades, outdoor advertising relied on a familiar formula: traffic counts, demographic reports, physical scouting, and local market intuition.
A billboard company looking to place a new asset in Cleveland, Chicago, or Kansas City would typically send teams into the field, study traffic reports, evaluate nearby businesses, and estimate visibility and impressions based on historical data. Even sophisticated organizations often relied on fragmented systems, outdated traffic studies, or manually assembled datasets.
That model is beginning to change.
A new generation of geospatial analytics tools is allowing organizations to evaluate billboard placement using dynamic, real-time intelligence layers powered by AI, mobility data, environmental context, and spatial modeling. Instead of treating a billboard as a static physical asset, companies can now analyze it as part of a living operational environment shaped by traffic flow, consumer behavior, weather conditions, nearby businesses, and roadway visibility.
At the center of this shift is a broader evolution happening inside the Google ecosystem itself. Historically, Google Maps data was primarily visualized through APIs and consumer-facing applications. Today, Google is increasingly making that data available as analyzable enterprise datasets that can be layered, modeled, and operationalized inside cloud environments like BigQuery. For companies responsible for outdoor advertising strategy, that changes the nature of site selection entirely.
The Rise of Layered Geospatial Intelligence
Modern billboard siting is no longer a single-variable exercise centered around vehicle counts. Organizations now have access to multiple geospatial intelligence layers that can be combined into predictive models.
Roads Management Insights (RMI) provides visibility into traffic congestion, roadway patterns, and transportation movement. Instead of relying solely on annual traffic studies, organizations can analyze historical and near real-time traffic behavior to understand where congestion forms, how routes shift throughout the day, and which corridors generate sustained visibility opportunities.
RMI also dramatically reduces dependence on traditional hardware-based traffic collection methods. Rather than deploying expensive roadside infrastructure or relying exclusively on periodic surveys, organizations can access scalable roadway intelligence directly through Google’s cloud ecosystem. Historical analysis, near real-time traffic conditions, and congestion forecasting can all be operationalized inside BigQuery.
Street View Insights introduces another layer. Using Google Street View imagery, aerial imagery, and AI-powered analysis, organizations can identify billboards, utility poles, lines of sight, roadway obstructions, and surrounding physical infrastructure without sending teams into the field. In practice, this means companies can evaluate visibility and contextual surroundings remotely and at scale.
Population Dynamics Insights (PDI) adds a fundamentally different form of behavioral intelligence. Rather than manually assembling dozens of demographic and environmental variables, PDI delivers ML-ready geospatial embeddings directly into BigQuery. These embeddings distill aggregated behavioral and environmental signals (including Google Search trends, Maps activity patterns, points of interest, mobility behavior, air quality, and weather conditions) into rich multidimensional vectors that can immediately support predictive modeling workflows.
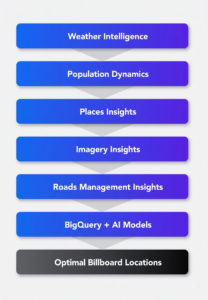
Places Insights contributes rich point-of-interest data directly from Google Maps. Businesses can evaluate nearby commercial activity, restaurant density, retail presence, transit access, or entertainment districts to better understand the contextual value of a given billboard location.
More importantly, Places Insights enables organizations to build what Google describes as “commercial fingerprints” of successful environments. By analyzing the composition and density of surrounding businesses, advertisers can identify the contextual patterns associated with high performing billboard locations.
This also enables white-space analysis. Organizations can identify underserved advertising corridors, emerging commercial zones, or rapidly growing areas before competitors recognize the opportunity. Combined inside Google BigQuery, these datasets become significantly more powerful than any individual product on its own.
The value comes from layering the datasets together: traffic, weather, imagery, demographics, mobility patterns, environmental conditions, and points of interest. Once those datasets are aggregated inside a centralized analytics environment, organizations can begin making predictive decisions instead of relying on static analysis.
Moving Beyond Manual Site Selection
Traditional billboard siting often required expensive and time-consuming manual processes. Teams physically drove markets to evaluate visibility. Organizations relied on static traffic studies that quickly became outdated. Analysts manually assembled demographic reports, commercial development data, and roadway information from disconnected systems.
The modern geospatial analytics approach changes that workflow fundamentally. Using BigQuery as a centralized analytics environment,
organizations can combine proprietary advertising data with Google geospatial datasets and public demographic information to build predictive models around site performance.
A billboard operator, for example, could input the characteristics of its highest-performing billboard locations into a machine learning model. That model could analyze the surrounding conditions associated with those successful sites:
- Traffic behavior
- Nearby businesses
- Population movement
- Roadway visibility
- Congestion patterns
- Weather conditions
- Commercial density
- Demographic alignment
The system could then identify “sibling” regions in entirely different markets that exhibit similar environmental and behavioral characteristics.
This concept of similarity modeling dramatically changes expansion strategy. Instead of relying on intuition or generalized market assumptions, organizations can identify locations that statistically resemble their best-performing environments.
Similarity Modeling Process
- Top-Performing Billboard Locations
- Analyze Conditions (traffic, weather, POIs, demographics)
- AI Similarity Model
- Identify “Sibling Markets”
- Rank New Opportunities
The same architecture also enables “cold-start geographic analysis.” Rather than waiting years to accumulate local historical data, organizations can project successful environmental and behavioral patterns into entirely new territories. A billboard operator entering a new city can identify high-potential corridors before deploying physical infrastructure or conducting extensive field analysis.
The Operational Role of BigQuery and AI
A major shift enabling these capabilities is Google’s decision to make geospatial data analyzable rather than purely visual.
Historically, many Google Maps integrations relied on APIs that allowed organizations to display mapping information but restricted deeper analysis or integration with enterprise datasets.
Today, many of Google’s newer Insights products are designed specifically for operational analytics workflows.
BigQuery functions as the central operational environment where organizations can:
- ingest proprietary datasets
- query Google geospatial information
- aggregate public and third-party datasets
- build machine learning models
- generate predictive spatial analysis
This architecture allows organizations to operationalize geospatial intelligence instead of simply viewing it on a map. For billboard placement, that could include:
- identifying corridors with heavy congestion but low billboard density
- analyzing weather-driven traffic variability
- forecasting seasonal visibility changes
- evaluating nearby commercial activity
- identifying high-value visibility corridors before competitors do
Machine learning models running inside BigQuery can also streamline feature engineering. Rather than manually building dozens of custom variables, organizations can leverage ML-ready embeddings directly from Google’s datasets to accelerate predictive analysis.
In practice, that means organizations can use relatively lightweight downstream models—including linear regression, gradient boosted decision trees, or multi-layer perceptrons—to rapidly evaluate site potential at scale.
The result is a significantly more scalable approach to geomarketing and site intelligence.
Weather as an Operational Intelligence Layer
Weather is becoming increasingly important in geospatial advertising analysis.
Traffic patterns shift dramatically based on environmental conditions. In northern cities like Cleveland or Chicago, snow, rain, and seasonal conditions can radically alter commuting behavior, congestion levels, and visibility windows.
A billboard that performs exceptionally during summer commuting patterns may generate entirely different impression dynamics during winter months.
By integrating weather intelligence alongside Roads Management Insights and mobility analytics, organizations can better understand:
- Where audiences will move
- Where congestion will form
- Where visibility will increase
- Where commercial activity will emerge
- Where advertising infrastructure will generate the greatest long-term value
This transforms weather from a background variable into an operational intelligence layer that directly influences placement strategy and campaign optimization.
From Visualization to Predictive Decision-Making
Perhaps the biggest shift occurring in geospatial analytics is conceptual.
Organizations are moving beyond maps as visualization tools and toward geospatial intelligence as an operational decision system.
The power is in predicting.
That transition is especially important for companies operating at national or regional scale. Manual field analysis simply cannot compete with AI-assisted geospatial modeling across hundreds or thousands of potential locations.
For outdoor advertising firms, agencies, and brands, this creates a new level of operational precision.
Instead of reacting to existing markets, organizations can proactively identify opportunity corridors before they become obvious.
The Future of Outdoor Advertising Intelligence
As Google continues expanding its geospatial analytics ecosystem, the operational possibilities will continue to grow.
AI-powered imagery analysis, real-time mobility intelligence, predictive traffic modeling, weather analytics, and behavioral embeddings are converging into a unified spatial intelligence environment capable of supporting increasingly sophisticated business decisions.
For outdoor advertising, that means billboard siting will become more predictive, more dynamic, and more operationally intelligent.
Organizations that successfully combine geospatial intelligence with AI-assisted analysis will gain a significant advantage in understanding not just where audiences are today, but where they are likely to move tomorrow.
The billboard itself may remain physical infrastructure, but the intelligence behind it is rapidly becoming predictive, connected, and AI-powered.